
Fundamentals of Machinery Vibration
By Nick Li · August 10, 2026 · Technical Articles
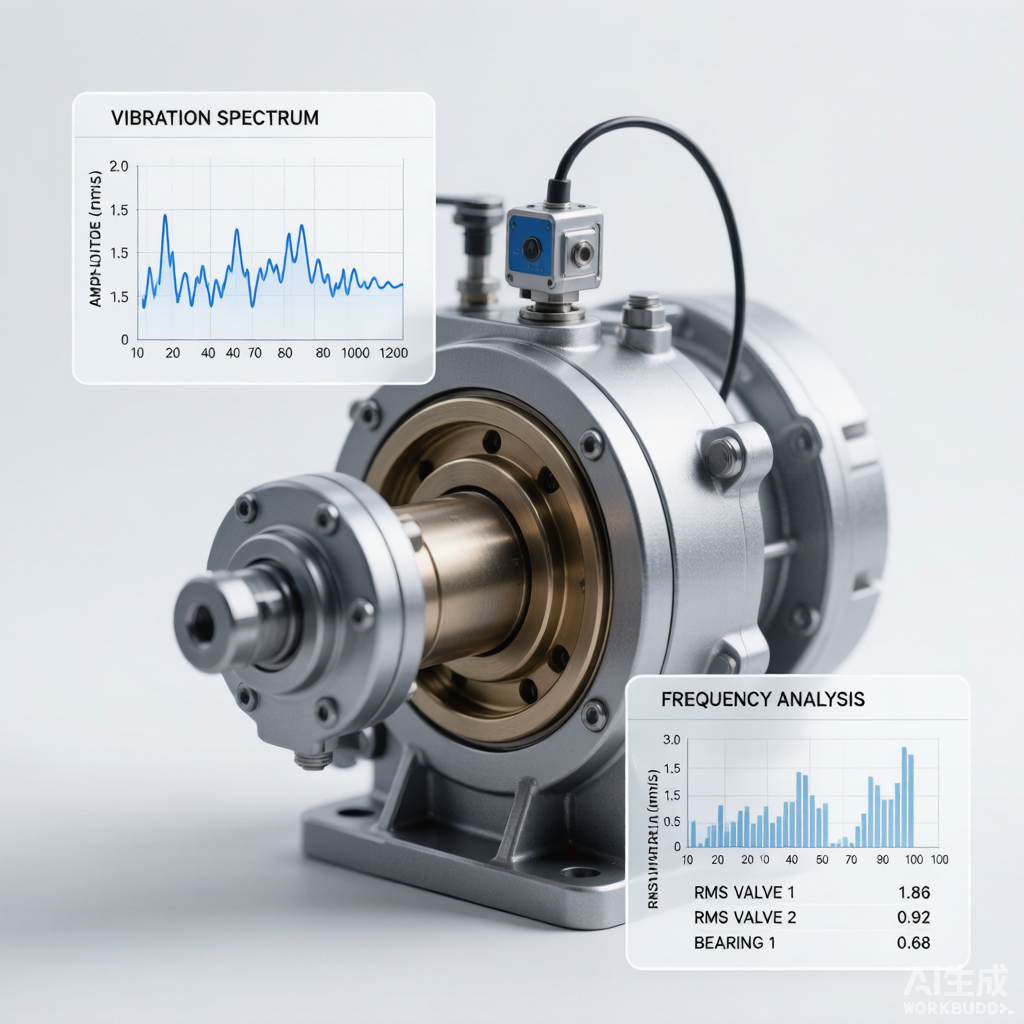
Vibration Analysis and Diagnosis of Industrial Compressors
Figure: Vibration spectrum analysis of an industrial reciprocating compressor showing characteristic fault frequencies
Fundamentals of Machinery Vibration
Vibration analysis remains one of the most powerful predictive maintenance tools available to compressor operators and reliability engineers. By interpreting the vibration signature of a machine, trained analysts can detect, diagnose, and trend mechanical faults long before they lead to catastrophic failure, allowing for condition-based maintenance planning rather than reactive repairs.
Vibration Parameters
Three fundamental parameters characterize machinery vibration, each optimal for different frequency ranges:
- Displacement (μm or mils): Measures the physical movement of a vibrating component from its neutral position. Displacement measurements are most effective at low frequencies, typically below 10 Hz (600 RPM). In slow-speed machinery such as large reciprocating compressors and cooling tower gearboxes, displacement provides the best indication of shaft movement, rotor-to-stator clearances, and structural deflection under load.
- Velocity (mm/s or in/s): Represents the rate of change of displacement and is the most commonly used parameter for general machinery condition assessment. Velocity measurements are effective across the broad mid-frequency range of 10 Hz to 1,000 Hz (600 to 60,000 RPM), which encompasses most common fault frequencies in industrial compressors. Velocity is directly related to vibration energy and fatigue stress, making it the preferred parameter for severity assessment.
- Acceleration (g or m/s²): Measures the rate of change of velocity and is most sensitive to high-frequency vibration, typically above 1,000 Hz. Acceleration is invaluable for detecting early-stage bearing defects, gear mesh issues, and cavitation phenomena. Modern piezoelectric accelerometers can measure frequencies from below 1 Hz to above 20,000 Hz, covering the full range needed for comprehensive compressor diagnostics.
Units and Measurement Standards (ISO 10816)
The International Organization for Standardization publishes ISO 10816, a multi-part standard that defines vibration severity criteria for various machine classes. For industrial compressors, ISO 10816-3 and ISO 10816-7 (for reciprocating compressors) are most relevant. The standard classifies machines into groups based on power rating, foundation type, and operating speed, and provides vibration velocity limits (in mm/s RMS) for four evaluation zones.
Zone A covers new machines in the acceptance test condition; Zone B covers machines suitable for long-term continuous operation; Zone C defines alert conditions where limited-term operation is acceptable until a suitable maintenance window; and Zone D defines dangerous vibration levels where damage can occur. For a typical 1,500 kW centrifugal compressor on a rigid foundation operating at 3,000 RPM, the Zone A/B boundary is approximately 2.8 mm/s, while the Zone C/D boundary reaches 7.1 mm/s RMS. These thresholds serve as starting points, but plant-specific baselines and trending data should always take precedence over generic limits.
Vibration Measurement Techniques
Accurate and repeatable vibration measurements are the foundation of any successful condition monitoring program. The selection of sensor type, mounting method, and measurement location directly influences data quality and diagnostic capability. Modern portable analyzers and permanent monitoring systems employ multiple transducer types and advanced signal processing to capture the full vibration picture.
Accelerometer Placement and Mounting
Proper accelerometer mounting is critical for obtaining reliable vibration data. The following factors must be considered:
- Location selection: Measurements should be taken at each bearing housing or as close to the bearing as possible, in three orthogonal directions: horizontal (H), vertical (V), and axial (A). The vibration transfer path from the source (rolling element, rotor imbalance) to the measurement point should be as short and rigid as possible. Avoid measuring through gaskets, joints, or non-structural covers that attenuate high-frequency signals.
- Mounting methods: Stud mounting provides the best frequency response (usable to 15+ kHz) and is preferred for permanent installations. Magnetic bases offer convenient portability but limit usable frequency range to approximately 5 kHz. Handheld probes (stinger) are the most common for route-based data collection but are highly operator-dependent; consistent probe pressure, angle, and positioning are essential for trendability. Adhesive mounting pads represent a compromise, providing reasonable high-frequency response with semi-permanent attachment.
- Surface preparation: The mounting surface must be clean, flat, and free of paint or coatings. A thin layer of silicone grease or petroleum jelly between the sensor and surface can improve high-frequency coupling. For permanent installations on rough cast surfaces, a spot-faced mounting pad with a flatness tolerance of 0.025 mm is recommended.
Frequency Spectrum Analysis (FFT)
The Fast Fourier Transform (FFT) converts complex time-domain vibration signals into the frequency domain, revealing individual frequency components and their amplitudes. This spectral representation is the primary diagnostic tool for machinery fault identification. Key FFT analyzer settings include:
- Frequency span (Fmax): Should be set to capture at least 3.25× the highest expected fault frequency. For a compressor with rolling element bearings, Fmax should cover bearing defect frequencies which can exceed 50× shaft speed. Typical Fmax settings range from 1,000 Hz for general-purpose machines to 10,000 Hz for high-speed compressors with gearboxes.
- Resolution (lines of FFT): Higher resolution (more lines) provides better separation of closely spaced frequencies. A minimum of 800 lines is recommended for general diagnostics, while 3,200 lines or higher is required for resolving sideband patterns around gear mesh frequencies. Resolution bandwidth (Fmax / lines) should typically be less than 10% of the running speed for accurate speed-harmonic identification.
- Averaging: Linear averaging with 4-8 averages improves signal-to-noise ratio without excessively prolonging measurement time. Peak-hold averaging is useful for capturing transient events. Overlap processing (67-75%) reduces total measurement time while maintaining statistical confidence.
Time Waveform Analysis
While FFT spectra are indispensable, time waveform analysis provides complementary information that can reveal faults invisible in the frequency domain. The raw time signal captures amplitude modulation, transient impacts, rubs, and the precise shape of repetitive events. Key time waveform analysis techniques include:
- Impact detection: Short-duration, high-amplitude events from bearing spalls and gear tooth defects appear as sharp spikes in the waveform. The spacing between impacts corresponds to the defect frequency (BPFO, BPFI, etc.), and the severity of spalling can be estimated by the amplitude and sharpness of impacts.
- Orbit analysis: By plotting the horizontal vibration waveform against the vertical waveform (XY plot or Lissajous diagram), the orbital path of the shaft centerline can be visualized. Precession direction, orbit shape, and dynamic stiffness can be assessed directly from the orbit plot, providing insights into unbalance, misalignment, and fluid-induced instability issues.
- Modulation patterns: Amplitude modulation visible in the waveform envelope often indicates bearing or gear faults. The modulation frequency (carrier) and modulation rate (sideband spacing) provide diagnostic clues about the specific component and fault type.
Phase Measurement
Phase analysis measures the angular relationship between a vibration signal and a reference trigger, typically once-per-revolution from a tachometer or keyphasor. Phase is essential for:
- Balancing: Phase angle identifies the heavy spot location on the rotor relative to the reference mark. Changes in vibration amplitude and phase across a machine speed range can distinguish between unbalance (gradual phase change) and resonance (abrupt 180° phase shift).
- Misalignment diagnosis: Parallel (offset) misalignment produces a 180° phase difference across the coupling in the radial direction, while angular misalignment shows a 180° phase difference in the axial direction. Combined misalignment produces intermediate phase relationships.
- Structural resonance identification: Operational Deflection Shape (ODS) and Experimental Modal Analysis (EMA) use phase and amplitude data from multiple measurement points to animate machine and structural deformation at specific frequencies, identifying resonant modes that may require stiffening or damping.
Diagnosing Common Faults Through Vibration
Imbalance
Rotor imbalance is the most common cause of excessive vibration in rotating machinery. It occurs when the rotor mass centerline does not coincide with its rotational centerline, creating a centrifugal force that rotates with the shaft. In compressors, imbalance can result from uneven material deposition on impellers, thermal bowing, erosion, or incorrect assembly after maintenance.
- Key diagnostic characteristic: Dominant vibration at 1X rotational frequency (shaft speed). The amplitude is proportional to the square of the speed (amplitude ∝ RPM²). At constant speed, amplitude is steady with minimal fluctuation.
- Spectral pattern: A single dominant peak at 1X RPM, with harmonic amplitudes typically less than 5-10% of the fundamental. Phase between inboard and outboard bearings on the same rotor should be close to 0° for static unbalance and 180° for couple unbalance.
- Directional characteristics: Radial vibration (horizontal and vertical) dominates, with relatively low axial vibration. Horizontal vibration is usually higher than vertical on horizontally split machines due to lower horizontal stiffness.
Misalignment
Shaft misalignment between driver (motor, turbine) and driven compressor is another prevalent fault. Two types exist: parallel (offset) misalignment where shaft centerlines are parallel but not coincident, and angular misalignment where centerlines intersect at an angle. Most real misalignment cases are a combination of both.
- Key diagnostic characteristic: Strong vibration at 2X rotational frequency, often exceeding the 1X amplitude when misalignment is severe. The 2X component arises because the coupling experiences two force reversals per revolution when shafts are misaligned.
- Spectral pattern: Prominent 1X and 2X peaks. In severe cases, harmonics at 3X, 4X, and even 5X may be present. The ratio of 2X to 1X amplitude provides a qualitative indication of misalignment severity.
- Directional characteristics: Axial vibration is typically high for angular misalignment (often 50% or more of radial vibration). The phase difference across the coupling is 180° ± 30° in the direction of the offset. Thermal growth during operation from cold to hot alignment must be accounted for in precision shaft alignment procedures.
Mechanical Looseness
Mechanical looseness describes a condition where a machine component has excessive clearance relative to fasteners or its support structure. In compressors, looseness commonly manifests at bearing housings, soleplates, foundation bolts, or internal clearances between the shaft and bearing.
- Type A (Structural looseness/foundation weakness): This produces 1X vibration elevated predominantly in one direction (typically vertical). Phase measurements at the machine feet will reveal differences of 90°-180° between the machine foot and its foundation, indicating relative motion from loose bolts or cracked grout.
- Type B (Loose bearing housing/pedestal): Produces a truncated or flattened time waveform due to impacting as the housing moves within its clearance. The spectrum contains multiple harmonics of running speed (1X, 2X, 3X, 4X, 5X) or half-harmonics (0.5X, 1.5X, 2.5X) when looseness creates an intermittent rocking motion.
- Type C (Internal clearance looseness): Bearing liner looseness or excessive rotor-to-bearing clearance generates a spectrum rich in sub-harmonics (1/2X, 1/3X, 1/4X), closely resembling the signature of rotor rub. The time waveform shows a characteristic truncation pattern associated with lift-off and impact behavior.
Rolling Element Bearing Defects
Rolling element bearings in compressors are subject to fatigue spalling, lubrication failure, contamination, and electrical erosion. Each bearing component has a characteristic defect frequency calculated from bearing geometry and rotational speed:
- BPFO (Ball Pass Frequency Outer Race): Generated when a rolling element passes over a defect on the outer race. The formula is: BPFO = (N/2) × RPM × [1 – (Bd/Pd) × cos(θ)], where N is the number of rolling elements, Bd is ball diameter, Pd is pitch diameter, and θ is the contact angle. BPFO is typically non-synchronous and depends on the number of rolling elements.
- BPFI (Ball Pass Frequency Inner Race): Generated by a defect on the inner race. BPFI = (N/2) × RPM × [1 + (Bd/Pd) × cos(θ)]. Because the inner race rotates, BPFI amplitudes are often modulated by shaft speed, producing sidebands spaced at 1X RPM around the BPFI frequency.
- BSF (Ball Spin Frequency): BSF = (Pd/(2 × Bd)) × RPM × [1 – (Bd/Pd)² × cos²(θ)]. A defect on a single ball or roller generates impacts at 2 × BSF (because the defect contacts both races per ball revolution).
- FTF (Fundamental Train Frequency/Cage): FTF = (1/2) × RPM × [1 – (Bd/Pd) × cos(θ)]. The cage frequency is typically 0.35-0.45 × RPM. A defect on the cage or its sliding surfaces generates vibration at FTF and its harmonics.
Bearing faults pass through four progressive stages. Stage 1 (earliest) shows elevated ultrasonic and high-frequency energy detectable only by envelope analysis or high-frequency enveloping (HFE). Stage 2 shows discreet bearing defect frequencies in the spectrum with no harmonics. Stage 3 reveals harmonics of the defect frequency and the beginning of noise floor elevation. Stage 4 (failure) shows a “haystack” of random high-frequency energy, disappearance of the discrete defect frequency, and rapid degradation toward catastrophic failure.
Gear Faults
Gearboxes are common in compressor drive trains, coupling high-speed motors or turbines to lower-speed compressors, or between stages of multi-stage compressors. Gear-related vibration signatures are characterized by the gear mesh frequency (GMF), calculated as the number of gear teeth times the shaft rotational frequency: GMF = N_teeth × RPM.
- Normal gears: The spectrum shows GMF at low amplitude with harmonics at 2× GMF and 3× GMF. Sidebands at shaft speed (1X of each gear) are present at low amplitude and represent normal modulation from gear eccentricity and runout.
- Tooth wear: As teeth wear uniformly, the GMF amplitude increases, and its harmonics become more prominent. Sidebands remain present but typically at lower relative amplitudes compared to localized faults.
- Cracked or broken tooth: A localized defect produces a short-duration impact once per revolution when the damaged tooth enters mesh. The time waveform shows a sharp spike at the tooth repeat rate. In the spectrum, the GMF amplitude may increase, with strong sidebands spaced at the gear rotational frequency. The sideband amplitude relative to GMF provides a severity indicator; sidebands approaching 50% of GMF amplitude indicate serious damage.
- Gear misalignment: Produces high GMF and 2× GMF amplitudes, often with sidebands at the running speed of both the driving and driven gears. Axial vibration at GMF is typically elevated compared to radial vibration.
Resonance
Resonance occurs when a forcing frequency (such as shaft rotation speed, blade pass frequency, or gear mesh frequency) coincides with a natural frequency of a machine component or supporting structure. At resonance, even small excitation forces can produce dangerously large vibration amplitudes.
- Key diagnostic characteristic: A dramatic increase in vibration amplitude at a specific operating speed, with a phase shift of approximately 180° as the speed passes through the resonance. The amplification factor (Q factor) can range from 2-3 for highly damped structures to 50+ for lightly damped components.
- Identification methods: Impact (bump) testing uses an instrumented hammer to excite the structure across a frequency range while measuring the response to identify natural frequencies. Coast-down (run-down) data, collected as the machine decelerates from operating speed to rest, reveals resonances as amplitude peaks at specific speeds. Operational Deflection Shape (ODS) analysis maps the deformation pattern at suspected resonant frequencies to guide structural modifications.
- Remediation: Resonance is addressed by shifting the natural frequency away from the excitation frequency (stiffening or adding mass), or by reducing the excitation force itself (balancing, alignment). In compressor piping systems, acoustic resonance at the compressor discharge pulsation frequency can cause fatigue failures; adding pipe supports, changing span lengths, or installing pulsation dampeners are common solutions.
Vibration Severity Assessment
Interpreting vibration data requires a structured severity classification system. ISO 10816-3 provides vibration velocity limits for industrial machines with power ratings between 15 kW and 300 kW, which are broadly applicable to many compressor applications. The standard defines four evaluation zones and provides separate limits for rigid and flexible foundations. The table below summarizes the vibration severity zones for machines on rigid foundations. Vibration velocity is measured in mm/s RMS, broadband (typically 10-1,000 Hz).
| Machine Group | Power Range | Mounting | Zone A/B (mm/s) |
Zone B/C (mm/s) |
Zone C/D (mm/s) |
|---|---|---|---|---|---|
| Group 1 – Large machines | >300 kW | Rigid | 2.3 | 4.5 | 7.1 |
| Group 1 – Large machines | >300 kW | Flexible | 3.5 | 7.1 | 11.0 |
| Group 2 – Medium machines | 15-300 kW | Rigid | 2.8 | 7.1 | 11.0 |
| Group 2 – Medium machines | 15-300 kW | Flexible | 4.5 | 9.3 | 14.0 |
| Group 3 – Pumps (integrated) | >15 kW | Rigid | 2.3 | 4.5 | 7.1 |
| Group 3 – Pumps (integrated) | >15 kW | Flexible | 3.5 | 7.1 | 11.0 |
| Group 4 – Recip. compressors | All | Rigid | 7.1 | 11.0 | 18.0 |
| Group 4 – Recip. compressors | All | Flexible | 11.0 | 18.0 | 28.0 |
| Gas turbines & centrifugal comp. | >3 MW | Rigid | 3.8 | 7.5 | 11.8 |
In practice, these ISO limits should be supplemented with plant-specific acceptance criteria. Trending is arguably more important than absolute amplitude: a machine that has historically operated at 1.5 mm/s that suddenly increases to 3.0 mm/s warrants investigation even if still within Zone B. Alarm and trip setpoints should be established for each measurement point based on baseline values and criticality assessment, typically set at 1.5× and 2.5× the normal operating level respectively.
Case Studies
Case 1: Bearing Inner Race Defect Detected by Envelope Analysis
A 2,500 kW centrifugal air compressor operating at 2,980 RPM in a petrochemical plant was monitored by an online vibration monitoring system with permanently mounted accelerometers at all bearing locations. Routine spectral analysis showed no alarm-level vibration; overall values at the non-drive-end (NDE) bearing remained at approximately 2.2 mm/s, well within the Zone A range.
However, periodic high-frequency envelope (HFE) analysis configured with a 500-10,000 Hz band-pass filter revealed an emerging pattern at approximately 168 Hz, with clear 1X sidebands (49.7 Hz). Review of the bearing specification (NU 224 cylindrical roller bearing, N=14 rollers, Pd=165 mm, Bd=22 mm, θ=0°) identified 168 Hz as the calculated BPFI (inner race defect frequency). The sidebands at 49.7 Hz (shaft speed) confirmed the inner race origin, as the defect rotates in and out of the load zone, modulating the impact amplitude.
Trending over six weeks showed progressive amplitude increase of the BPFI envelope peak from 0.02 gE to 0.15 gE, while overall vibration remained unchanged. A planned outage was scheduled; bearing replacement confirmed 15 mm of inner race spalling across two adjacent rollers. Early detection via envelope analysis avoided an estimated $180,000 in unplanned downtime costs.
Case 2: Coupling Misalignment Causing 2X Vibration
A 450 kW screw compressor driven by a 4-pole induction motor (1,485 RPM) experienced gradually increasing vibration at the motor inboard bearing over an 8-week period. Route-based vibration data collected monthly showed the following progression:
| Date | 1X Amplitude (mm/s) |
2X Amplitude (mm/s) |
Overall (mm/s) |
|---|---|---|---|
| Jan 15 | 2.1 | 1.2 | 2.8 |
| Feb 15 | 2.6 | 3.8 | 5.1 |
| Mar 15 | 2.8 | 6.2 | 7.4 |
The 2X component increased disproportionately, from 1.2 to 6.2 mm/s, while 1X remained relatively stable. Phase measurements across the coupling showed a 175° difference in the horizontal direction, consistent with parallel offset misalignment. Laser alignment revealed 0.38 mm of vertical offset (specification: <0.05 mm) due to thermal growth differences between the motor and compressor after installation. Realignment with thermal growth compensation restored vibration to 2.1 mm/s overall, with 2X component dropping to 0.8 mm/s.
Case 3: Structural Resonance in Piping System
A reciprocating hydrogen compressor (3-stage, 600 kW, 400 RPM) at a refinery experienced high vibration and repeated fatigue cracking on the second-stage discharge piping, between the compressor cylinder and the pulsation dampener. The pipe span was approximately 2.1 meters between supports, with a nominal diameter of DN 100 (4 inches).
Impact testing of the piping span with an instrumented hammer identified a first-mode natural frequency at 41 Hz. The compressor discharge pulsation fundamental frequency was 40 Hz (6.67 Hz shaft speed × 6th order pulsation from the double-acting cylinder). The proximity of the pulsation frequency to the pipe natural frequency created a resonant condition, resulting in vibration amplitudes exceeding 25 mm/s at the mid-span and alternating bending stresses above the fatigue endurance limit of the pipe material.
Three remediation strategies were evaluated: (1) adding damping by wrapping the pipe with a constrained-layer damping material, (2) stiffening the span by adding an intermediate pipe support to raise the natural frequency above 60 Hz (1.5× the pulsation frequency), and (3) installing an orifice plate to modify the acoustic response. Option 2 was selected for its effectiveness and simplicity. After installation of an intermediate clamp support at 0.9 meters from the compressor flange, the natural frequency increased to 89 Hz, and measured vibration reduced to 4.2 mm/s at the span midpoint. No further cracking was reported over two years of subsequent operation.
Source: Compressor Maintenance Forum