
The True Cost of Compressed Air
By Nick Li · August 10, 2026 · Technical Articles
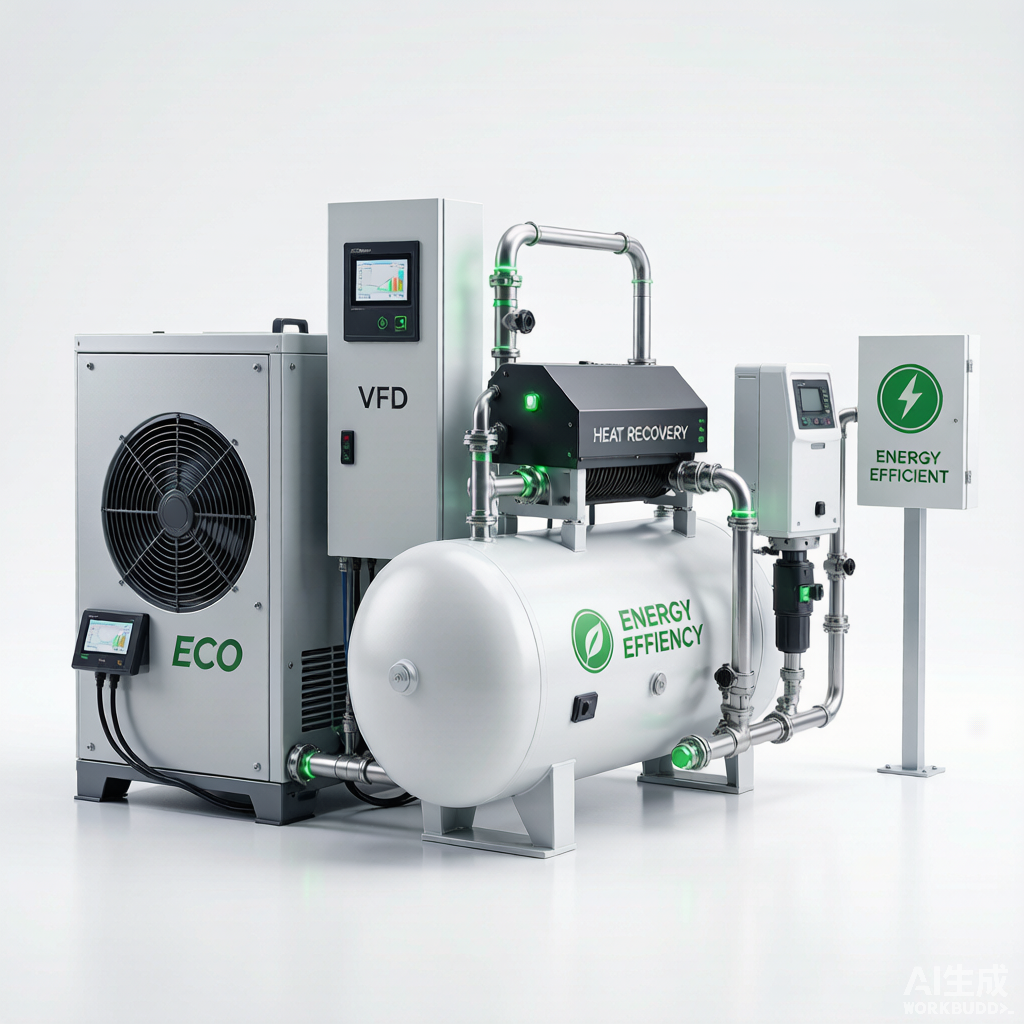
Energy Efficiency Optimization in Compressed Air Systems
Figure: Energy-efficient compressed air system with variable frequency drive compressor and heat recovery unit
The True Cost of Compressed Air
Compressed air is often referred to as the “fourth utility” in industrial facilities, alongside electricity, water, and natural gas. Yet unlike those utilities, compressed air is typically generated on-site, and its true cost is frequently underestimated by facility managers and operators. Understanding the full lifecycle cost of compressed air is the essential first step in identifying and prioritizing energy-saving opportunities.
Energy Costs Dominate Lifecycle Economics
A typical industrial air compressor operating 8,000 hours per year will consume electricity costing 70-80% of its total lifecycle cost over a ten-year period. Equipment purchase represents only 10-15%, while maintenance accounts for the remaining 5-10%. This distribution means that purchasing decisions based purely on initial capital cost without considering energy efficiency are fundamentally flawed.
Example calculation: A single 160 kW compressor operating 8,000 hours per year at an electricity rate of $0.10/kWh consumes approximately $128,000 in electricity annually. Over ten years, energy costs reach $1.28 million compared to a purchase price of perhaps $80,000-$120,000. A 20% improvement in specific energy consumption (kW/m³/min) would save over $250,000 across the equipment lifespan—far exceeding any price difference between compressor brands.
Air Leaks: The Silent Drain on Profitability
Air leaks represent the single largest source of wasted energy in most compressed air systems. Industry surveys consistently find that unmaintained systems leak 20-30% of total compressed air production, with poorly maintained systems reaching 40% or higher. The energy cost of individual leaks is surprisingly large:
- A single 3 mm diameter leak at 7 bar pressure: Loses approximately 1.8 liters per second (3.8 CFM). Over 8,760 continuous operating hours per year, this single leak wastes approximately 56,700 m³ of compressed air. With a typical specific power of 0.12-0.15 kWh/m³, the energy cost of this one leak ranges from $680 to $850 per year. A facility with 50 such undetected leaks can waste $34,000-$42,500 annually on nothing but producing air that escapes unused.
- Leak detection and repair: An ultrasonic leak detection survey can identify and tag leaks during operation without interrupting production. A structured leak management program with quarterly surveys and timely repairs typically reduces leak losses to below 10% of system output within 12 months. The payback period for professional leak detection services is typically measured in weeks, not months.
Pressure Drop and Its Energy Impact
Pressure drop in the distribution system—from the compressor discharge to the point of use—forces the compressor to operate at a higher discharge pressure to maintain adequate pressure at the tools and processes. Every 1 bar (14.5 psi) of unnecessary system pressure increase raises compressor energy consumption by approximately 7%. Common sources of pressure drop include:
- Undersized piping: Piping that is too small for the flow rate creates excessive friction losses. Doubling pipe diameter reduces pressure drop by a factor of approximately 32 at the same flow rate (pressure drop ∝ 1/diameter⁵). The incremental cost of larger piping is typically recovered within months through reduced energy consumption.
- Clogged filters and dryers: Filters and dryers with fouled elements create unnecessary restriction. Differential pressure across filtration should be monitored, and elements should be replaced based on pressure drop rather than calendar schedule alone.
- Restrictive fittings: Sharp elbows, tees, and partially closed valves create turbulence and localized pressure losses. Long-radius elbows and full-port valves minimize these losses. Every unnecessary fitting represents a permanent energy tax on system operation.
Variable Frequency Drive (VFD) Compressors
How VFD Matches Air Supply to Demand
Traditional fixed-speed compressors operate in load/unload or inlet modulation control modes, where the compressor either runs at full capacity or idles, and the motor continues consuming 25-35% of full-load power even when unloaded. A VFD compressor, by contrast, varies the motor speed—and thus the air output—in direct proportion to system demand by adjusting the frequency of the electrical supply to the drive motor.
A pressure transducer in the air receiver or distribution piping provides a feedback signal to the VFD controller. When system pressure drops below the setpoint (indicating increased air demand), the VFD increases motor speed to deliver more air. When pressure rises above the setpoint, speed decreases. This closed-loop control maintains discharge pressure within a narrow deadband (typically ±0.1-0.2 bar), compared to the wide pressure swing (typically 0.5-1.0 bar) required for load/unload control.
Energy Savings Potential
The energy savings from VFD technology derive from two mechanisms. First, the affinity laws for centrifugal machines state that power consumption varies with the cube of speed: reducing speed by 20% reduces power consumption by approximately 49%. Second, eliminating the unloaded power draw of fixed-speed control saves 25-35% of motor nameplate power during periods when the fixed-speed compressor would be running unloaded.
- Compressor curves: At 100% load, a VFD compressor is approximately 3-5% less efficient than an equivalent fixed-speed machine due to VFD losses (typically 2-3%) and slightly different aerodynamic design. Below 100% load, however, the cubic power-speed relationship quickly overcomes this efficiency gap. At 70% load, a VFD compressor consumes approximately 35% less power than a load/unload machine; at 50% load, savings approach 50%.
- Real-world results: Independent monitoring studies across multiple industries report average energy savings of 25-50% after converting from fixed-speed to VFD compressor control. The highest savings are achieved in systems with highly variable demand patterns, such as multi-shift manufacturing plants where air demand varies significantly between production periods and non-production hours.
When VFD Is and Is Not Appropriate
VFD technology is not a universal solution. Key application considerations include:
- Suitable applications: Systems with demand variation exceeding 30% of average load; single-compressor installations or installations where the VFD unit is the trim compressor; lubricated rotary screw compressors from 15-500 kW; centrifugal compressors with inlet guide vanes where VFD replaces or supplements mechanical modulation.
- Less suitable applications: Base-load compressors operating above 90% capacity for most of their operating hours (the VFD efficiency penalty makes fixed-speed more economical); reciprocating compressors (VFD has limited torque at low speeds); environments with high ambient temperatures and poor ventilation (VFD drives require cooling and clean power supply); applications where power quality issues such as harmonics could affect sensitive equipment (harmonic filtering adds cost).
Heat Recovery Systems
An air compressor converts approximately 95% of its electrical input energy into heat during the compression process. A mere 5% remains as potential energy in the compressed air itself. Without heat recovery, this thermal energy is rejected to the atmosphere through cooling systems (air-cooled or water-cooled), representing a complete waste of the majority of input energy. Heat recovery systems capture this thermal energy for productive use, dramatically improving overall system efficiency.
- Space heating: The simplest and most common heat recovery application. Warm cooling air from air-cooled compressors can be ducted to adjacent warehouse, workshop, or office areas during the heating season, reducing or eliminating the load on conventional heating systems. A 160 kW compressor rejects approximately 152 kW of thermal energy; ducting this into a facility can displace a significant portion of gas or electric heating costs. Automated dampers with thermostatic control prevent over-heating and route excess heat outdoors when space heating is not required.
- Water heating: Water-cooled compressors can heat water to 70-90°C through plate heat exchangers. This hot water can supply wash-down stations, process cleaning, boiler feedwater pre-heating, or facility hot water systems. For a 200 kW water-cooled compressor operating 6,000 hours per year, the recoverable thermal energy is approximately 1,080 MWh annually—equivalent to 92,900 liters of heating oil or 97,000 m³ of natural gas. With typical industrial gas prices, the annual savings can exceed $30,000-$50,000.
- Process heating: In facilities with continuous thermal processes—drying ovens, parts washers, paint curing booths, or chemical process heating—recovered compressor heat can supplement or replace dedicated process heaters. Integrating heat recovery into process heating requires careful matching of heat availability (a function of compressor operating hours) with process heat demand timing. Thermal storage (hot water buffer tanks) can decouple generation from consumption, enabling heat recovery from compressors operating during off-peak hours to supply daytime process loads.
Up to 90% of the electrical energy input to a compressor can be recovered as useful heat with a properly designed heat recovery system. The economic return on heat recovery investment is typically 1-3 years, and in some cases less than 12 months for compressors larger than 100 kW operating continuously. Despite this compelling business case, heat recovery remains underutilized in industry; an estimated 90% of installed compressor capacity worldwide currently rejects all compression heat to the environment.
Air Treatment Efficiency
Dew Point Selection: Do Not Over-Dry
Compressed air treatment—drying, filtration, and conditioning—consumes a significant portion of the total system energy budget. One of the most common efficiency mistakes is specifying an unnecessarily low pressure dew point (PDP) that requires substantially more energy than the application demands. The relationship between dew point and drying energy is highly non-linear.
A refrigerated dryer producing a +3°C PDP consumes approximately 1-3% of the compressor motor power. A heatless regenerative desiccant dryer producing a -40°C PDP, by comparison, consumes 15-20% of the compressor output as purge air, equivalent to 15-20% of compressor motor power—roughly five to ten times the energy cost of refrigerated drying. If -40°C PDP is not genuinely required by the process (outdoor piping in freezing climates, moisture-sensitive instrumentation, pharmaceutical or food-contact applications), the energy waste from over-drying compounds across the entire system lifecycle.
Pressure Dew Point Comparison Table
The table below summarizes the energy consumption, capital cost, and typical applications for common dryer types.
| Dryer Type | Achievable PDP | Energy Consumption | Relative Cost | Typical Application |
|---|---|---|---|---|
| Refrigerated (cycling) | +3°C to +10°C | 1.0-1.5% compressor kW | Low | General industrial, indoor piping |
| Refrigerated (non-cycling) | +3°C to +10°C | 2.0-3.0% compressor kW | Very Low | Steady-load, budget-sensitive |
| Desiccant (heated purge) | -20°C to -70°C | 5-8% compressor kW | Medium | Outdoor piping, instrumentation |
| Desiccant (heatless) | -20°C to -70°C | 15-20% compressor kW | Medium | Low-flow, intermittent demand |
| Desiccant (heated blower) | -20°C to -70°C | 3-5% compressor kW | High | Large flow, continuous duty |
| Membrane dryer | +3°C to -40°C | 15-20% compressor kW | Medium | Point-of-use, small flows |
Energy cost of different dryer types (refrigerated vs desiccant): For a 160 kW compressor operating 8,000 hours per year at $0.10/kWh, the energy cost of a refrigerated dryer is approximately $1,600-$3,840 per year. A heatless desiccant dryer for the same compressor would cost $19,200-$25,600 per year in purge air alone—a difference of up to $24,000 annually. Heated blower desiccant dryers reduce this penalty to approximately $3,840-$6,400, but with higher initial capital cost. Selecting the appropriate technology for the required dew point is one of the most impactful energy decisions in compressed air system design.
System Optimization Strategies
Pressure Reduction
Operating at the lowest possible system pressure that reliably meets all end-use requirements is the single most cost-effective energy efficiency measure in compressed air systems. The fundamental relationship is that every 1 bar (14.5 psi) reduction in system pressure saves approximately 7% of compressor energy consumption. A facility operating at 8.5 bar gauge that can reduce to 7.5 bar realizes approximately 7% energy savings with zero capital investment.
Practical implementation requires a pressure audit to identify the highest-pressure end uses and the points in the system experiencing the greatest pressure drops. Often, a small number of high-pressure users (typically 5-10% of total demand) require elevated pressure while the majority of the system could operate at lower pressure. Rather than pressurizing the entire system to meet these few users, localized pressure boosting at the point of use (via a small booster compressor or pressure amplifier) allows the main system pressure to be reduced, yielding net energy savings that typically pay for the booster within 6-18 months.
Pipe Sizing and Layout
The distribution piping network is the circulatory system of the compressed air system. Poor piping design causes pressure drop, promotes condensation, and creates bottlenecks that force compressors to work harder. Key design principles include:
- Loop (ring) layout: A closed-loop piping arrangement with air fed from multiple directions reduces pressure drop compared to radial (dead-end) layouts by providing parallel flow paths. The loop configuration ensures that any single point of use can be supplied via two alternative paths, reducing the effective velocity in any pipe segment and providing redundancy against pipe blockage or isolation.
- Proper velocity: Main header piping should be sized for air velocities below 6 m/s (20 ft/s) to minimize friction loss. Distribution drops to individual machines can tolerate higher velocities (up to 15 m/s) due to shorter lengths. A useful rule of thumb: a 1 bar pressure drop in the distribution system represents approximately 7% of compressor energy wasted—investing in larger piping is almost always justified by energy savings.
- Condensate management: All main piping should slope downward (minimum 1:100) in the direction of air flow with strategically placed drip legs and automatic condensate drains at all low points. Air take-offs from the main header should always be from the top of the pipe (never the bottom or side) to prevent liquid water entrainment. Zero-loss condensate drains (level-operated rather than timed) prevent compressed air loss that can equal several kW of compressor capacity per faulty drain.
Leak Detection and Repair Program
A formal leak management program with documented targets, responsible personnel, and regular measurement is one of the most cost-effective energy management initiatives available. The key program elements include:
- Baseline measurement: Quantify the current leak rate by measuring the rate of pressure decay in the receiver tank with all end-use valves closed, or by measuring compressor power draw during a no-production period.
- Regular surveys: Conduct ultrasonic leak detection inspections at least quarterly. Tag all identified leaks with unique identifiers, estimated flow rates, and repair priority. Photograph or mark leak locations for repair crews.
- Repair tracking: Establish a leak repair log and track time-to-repair for each identified leak. Set a target of less than 30 days from detection to repair. Measure repaired leak rate reduction to validate program effectiveness.
- Prevention: Address root causes of recurring leaks—vibration-induced loosening of threaded fittings (use welded or compression fittings in high-vibration areas), thermal cycling of connections (use flexible connections where movement is expected), and inappropriate materials in corrosive environments.
Multiple Compressor Control Strategies
Most industrial facilities operate multiple compressors, often of different sizes, types, and vintages. Without proper sequencing and control, multiple compressors will fight each other, cycling inefficiently and operating at suboptimal load points. Effective control strategies include:
- Cascade control (pressure band): Each compressor is assigned a specific pressure band (load/unload setpoints). The base compressor has the highest pressure band and runs continuously loaded. As demand increases and pressure drops, each subsequent compressor loads in sequence. This strategy is simple to implement with basic pressure switches but results in wide system pressure fluctuation (typically 0.7-1.4 bar) and wasted energy from compressors operating in unloaded state.
- Central sequencer/controller: An electronic controller monitors system pressure via a single high-accuracy pressure transducer and controls all compressors to maintain a tight pressure band (±0.1 bar). The sequencer can select the most efficient combination of compressors for the current load, equalize running hours, and rotate the lead compressor. Systems with one VFD trim compressor and multiple fixed-speed base compressors achieve optimal efficiency with a sequencer: the VFD modulates to fill the gaps between fixed-speed step changes.
- VFD base-load strategy: In systems with large, continuous base load and moderate variation, configuring a VFD compressor as the base machine (rather than the trim machine) can yield greater savings by maximizing VFD operating hours at part-load conditions where the cubic power-speed relationship provides the greatest efficiency advantage.
Monitoring and Measurement
The management adage “you cannot manage what you do not measure” is particularly apt for compressed air systems. Without reliable measurement of air flow, pressure, and energy consumption, efficiency initiatives operate in the dark—unable to establish baselines, verify savings, or sustain improvements over time.
Compressed Air Flow Meters
- Thermal mass flow meters: The most common technology for compressed air measurement. These meters measure the cooling effect of air flow on a heated sensor and provide direct mass flow measurement without temperature or pressure compensation. Insertion-type thermal mass flow meters can be installed through a hot-tap fitting without system shutdown. Accuracy of ±1-2% of reading is typical for well-installed meters with sufficient upstream and downstream straight pipe runs (typically 15D upstream, 5D downstream).
- Vortex shedding flow meters: These meters detect the frequency of vortices shed from a bluff body in the flow stream. Vortex frequency is proportional to volumetric flow rate. Vortex meters are suitable for wet or dirty compressed air where thermal meters may be affected by condensate or contamination, but they require pressure and temperature compensation to convert volumetric flow to mass flow. Accuracy is typically ±1-1.5% of reading.
- Ultrasonic flow meters (clamp-on): Non-intrusive clamp-on ultrasonic meters are ideal for temporary or survey measurements where permanent meter installation is not justified. They measure transit time difference of ultrasonic pulses traveling with and against the flow direction. While less accurate than insertion meters (±2-5% depending on pipe condition and installation quality), their portability makes them invaluable for system audits and leak quantification studies.
Energy Consumption Tracking (kWh per m³ of Air)
The most meaningful metric of compressed air system efficiency is specific energy consumption, expressed as kilowatt-hours of electrical energy consumed per cubic meter or cubic foot of compressed air produced (kWh/m³ or kW/100 CFM). This normalized metric accounts for both compressor efficiency and system losses. A well-designed and maintained industrial compressed air system should achieve:
- 0.10-0.13 kWh/m³ (16-21 kW/100 CFM): For systems with refrigerated drying, minimal leaks (<10%), pressure-optimized operation, and effective compressor control. This represents best-practice performance and should be the target for most industrial facilities.
- 0.14-0.18 kWh/m³ (22-29 kW/100 CFM): For typical systems with moderate leaks, basic dryer technology, and standard controls. Most unoptimized industrial systems fall into this range and have 20-35% improvement potential.
- >0.19 kWh/m³ (>30 kW/100 CFM): Indicates significant waste from leaks, over-pressurization, inappropriate compressor selection, or control problems. Systems in this range should undergo a comprehensive energy audit, as savings of 30-50% are typically achievable with a payback period under 2 years.
Key Performance Indicators (KPIs)
Establishing and trending KPIs drives continuous improvement in compressed air system efficiency. Essential KPIs include:
| KPI | Unit | Description |
|---|---|---|
| Specific energy | kWh/m³ (kW/100 CFM) | Total compressor energy ÷ total air production. Primary efficiency metric. |
| Leak rate | % of production | Air flow during zero demand ÷ average production flow. Target <10%. |
| Pressure drop (system) | bar (psi) | Compressor discharge pressure minus furthest point-of-use pressure. Target <0.3 bar. |
| Dew point compliance | Hours above PDP spec | Operating hours where actual PDP exceeds specified limit. Indicates dryer or condensate issues. |
| Compressor utilization | % | Average hourly air flow ÷ total installed capacity. Target 60-80% for load/unload systems. |
| Maintenance cost | $/kWh or $/m³ | Total maintenance spend ÷ total air production. Benchmarks trend analysis. |
Sustainable efficiency improvement requires both technology and culture. Compressed air system optimization is not a one-time project but an ongoing discipline. Facilities that establish baselines, set measurable targets, assign ownership, and hold regular review meetings consistently outperform those that treat compressed air as a background utility requiring only breakdown maintenance. The financial case is compelling: most facilities can reduce compressed air energy consumption by 20-50% with investments that pay back within 2 years, generating permanent cost reductions that flow directly to the bottom line.
Source: Compressor Maintenance Forum